
Greater Boston Housing Trends: Tracking Interest Rates, Prices, and Days on Market
Boston Market Update: Will Local Mortgage Rates Follow Oil and Inflation Downward?
📊 The Big Picture: Macroeconomics and local data are colliding. While global oil prices have plummeted back to pre-war levels since the June 17 MOU ended the US/Iran war, mortgage rates have lagged behind, held up by a hawkish Federal Reserve. But with indications that inflation may have already peaked, mortgage rates are finally starting to follow oil lower, creating a critical window for Greater Boston buyers and sellers.
Why It Matters
For city dwellers in their 20s to 50s eyeing a move to the suburbs, affordability is the ultimate hurdle. Understanding how macro inflation numbers translate directly into local inventory trends gives you a distinct advantage in a competitive market like Boston.
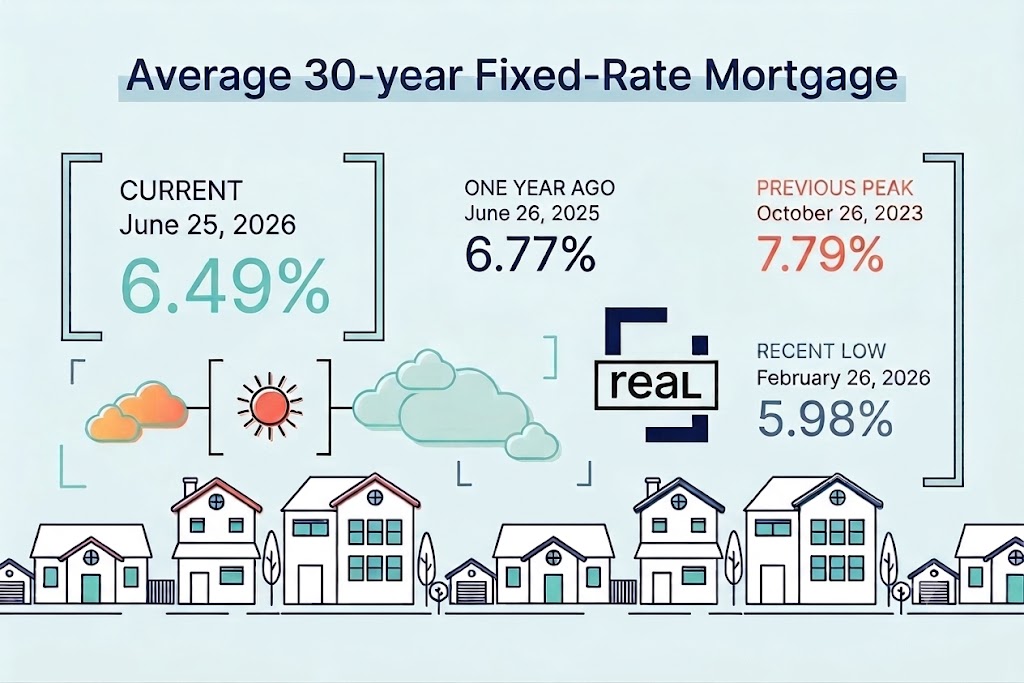
The National View: Affordability Dynamics
- Rates vs. Oil: US Treasury yields and mortgage rates are beginning a downward trend. Because energy costs influence the price of everything, sustained peace means borrowing rates should follow oil down.
- New Home Sales Slide: Nationally, new home sales fell 13% month-over-month in May to an annualized pace of 580K. This marks the second-slowest sales pace in nearly four years, driven by mid-6% interest rates and a $425K median price point. Large investors are also cutting back ahead of a projected single-family home purchase ban.
- Inflation Peak: The headline PCE index rose 0.4% month-over-month in May, driving the annual inflation rate up from 3.8% to 4.1% (the highest since April 2023). However, with oil retreating, signs point to this being the cycle's peak.
Local Market Pulse: Boston, MA Data
Here is exactly how the local market stood for the week ending Friday, June 26, 2026, showing changes from May to June:
| Market Metric | Boston, MA Status | Month-Over-Month Change |
|---|---|---|
| Median Price | $885,000 | -0.3% |
| Active Listings | 182 | 0.0% (Flat) |
| New Listings (Last 5 Days) | 12 | — |
| Median Days on Market | 24 days | +70.3% |
🔮 The Takeaway: Local home prices saw a slight 0.3% dip to an $885,000 median, while active inventory held steady at 182 properties. Crucially, median days on market spiked 70.3% to 24 days. This means properties are sitting slightly longer, giving upwardly mobile buyers more time to negotiate as rates begin to ease.


Disclaimer: This blog post is for informational purposes only and does not constitute financial advice. Consult with qualified professionals before making any financial decisions.Michael Mahoney 617-615-9435 mike@mmahoney.com www.HomesinBostonMass.com MA. License #9051300
Real Broker LLC License #423031 ☎️ 📆 Schedule a Call with Mike Now Linkedin Profile | Resume | Brochure | Client Testimonials | Facebook Page Twitter Youtube Instagram See all the Properties in Greater Boston @ www.HomesinBostonMass.com

- Who: Michael Mahoney, full-time Realtor.
- Where: Greater Boston (Norfolk, Suffolk, Bristol, Middlesex & Plymouth Counties).
- Experience: 20+ years in home ownership, wealth building & investment.
- Mission: Help clients achieve life goals through real estate.
- Clients: All price points; strong repeat & referral business.
Categories
Recent Posts